Chapter 9: Business Cycles, Unemployment, and Inflation
ECO 112 Principles of Macroeconomics
What Is a Business Cycle?
A business cycle is the recurring, but irregular, up-and-down movement of overall economic activity around the economy’s long-run growth trend.
- Recurring: expansions and contractions happen again and again.
- Irregular: no two cycles have the same length or severity.
- Around a trend: the economy does not cycle around zero growth, it cycles around the rising trend line from Chapter 8.

Durable Goods Feel a Downturn First
Not every industry feels a recession equally. Durable goods (cars, appliances, furniture, business equipment, new construction) and capital goods are hit much harder than nondurable goods and services (food, utilities, haircuts, health care).
Why? → Durable purchases can be postponed.
- If your income falls or your job feels shaky, you can keep driving your current car another year instead of buying a new one.
- You still need groceries, electricity, and a haircut regardless of the business cycle.

Who Counts as Unemployed?
Government statistics divide the working-age population into three groups:
- Employed: currently working.
- Unemployed: not working, but actively looking for work.
- Not in the labor force: not working and not looking, including retirees, full-time students, and discouraged workers who have given up looking for a job.
The labor force is employed plus unemployed. Someone who has stopped looking for work is not counted as unemployed at all.

The Market Basket and the CPI
The Consumer Price Index (CPI) tracks the cost of a fixed, representative “market basket” of goods and services that a typical household buys, relative to the cost of that same basket in a base period.
- The basket includes things like food, housing, transportation, medical care, and recreation.
- Because the basket is fixed, changes in the CPI over time reflect price changes, not changes in what people buy.
- The inflation rate is the percent change in the CPI from one period to the next.
The CPI is not the GDP price index from Chapter 7. They are both price indexes, but they measure different things:
- The CPI covers only what households buy, using a fixed basket.
- The GDP price index (deflator) covers everything produced domestically, including capital goods and government purchases, and its basket shifts with the economy’s actual output each year.

The Fisher Relationship: Real vs. Nominal Interest Rates
Inflation erodes the purchasing power of interest earned or owed. The real interest rate adjusts the nominal interest rate for inflation:
\[ \text{Real interest rate} = \text{Nominal interest rate} - \text{Inflation rate} \]
The nominal rate is the rate actually stated on a loan or savings account. The real rate tells you how much purchasing power you actually gain (or lose).

Irving Fisher, an American economist known for the Fisher equation relating nominal and real interest rates
Costs of Inflation, Even When Anticipated
Even moderate, fully anticipated inflation imposes real costs on an economy:
- Menu costs: the resources businesses spend updating prices, price tags, menus, catalogs, and computer systems, every time prices change.
- Shoe-leather costs: the time and effort people spend trying to avoid holding cash that is losing value, making more frequent trips to the bank or shifting funds into interest-bearing accounts.

Hyperinflation
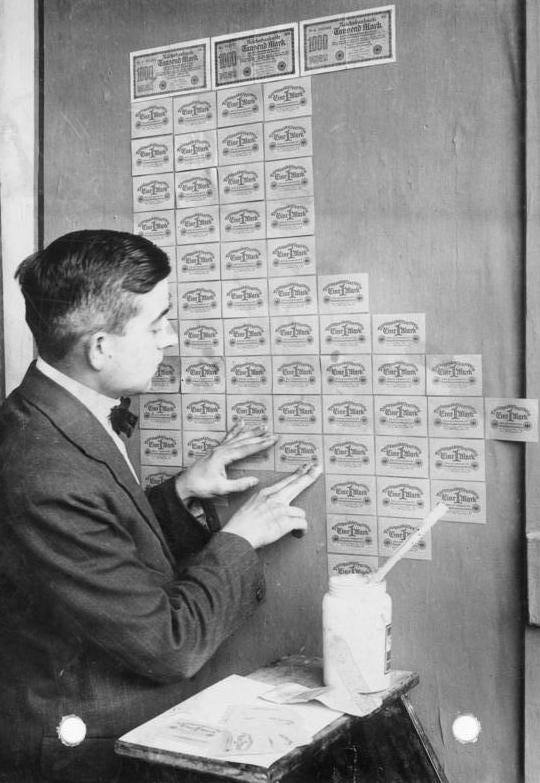
Hyperinflation is a very high and typically accelerating rate of inflation. It is far more damaging than ordinary inflation.
- Money loses value so quickly that people rush to spend it immediately, before prices rise again.
- Normal buying, selling, and production break down as money stops functioning as a reliable store of value.
- Total output can fall sharply as the economy struggles to function.
Real Data: Zimbabwe’s Hyperinflation
Zimbabwe’s 2007-2009 hyperinflation is one of the most extreme episodes in modern history, easily clearing the technical threshold economists use for hyperinflation (prices rising more than 50 percent per month).
- At its peak, in November 2008, the monthly inflation rate reached an estimated 79.6 billion percent, according to economist Steve Hanke.
- Zimbabwe’s central bank responded by printing ever-larger denominations, eventually issuing a 100 trillion dollar note.
- The currency ultimately collapsed. Zimbabwe abandoned its own dollar in 2009 and relied on foreign currencies instead.
